Synthesizing insights from over 10,000 professional interactions, this data-driven report deconstructs the architecture of modern connection. Explore the data, understand the friction points, and master the transition from a cold introduction to a closed deal.
The landscape of professional networking has shifted from serendipitous encounters to highly structured, algorithmically influenced journeys. We no longer rely solely on the chance meeting at a conference or the blind luck of a mutual acquaintance. Instead, networking has become a measurable process with distinct phases, predictable friction points, and actionable metrics.
By analyzing 10,000+ interactions across 45 industries, we have mapped the modern networking journey. This report reveals the macro-trends driving professional relationships today and provides a step-by-step breakdown of how to navigate the path from initial discovery to final decision.
Phase 1: Discovery
This section explores the genesis of professional relationships. How do people find the contacts they need? We map the distribution of discovery channels and analyze the strategic weight of each.
| Channel | Volume Share | Deep-Dive Analysis |
|---|---|---|
| Referrals | 42% | Direct human referrals remain the undisputed king of high-value discovery. The "Trust Transfer" phenomenon dramatically shortens the evaluation phase. Referrals increase the likelihood of a first meeting by 75%. |
| Social Platforms | 28% | Platforms like LinkedIn account for 28% of connections. "Ambient networking" (discovering someone through content resonance) has a 40% higher response rate than connections based solely on shared job titles. |
| In-Person Events | 18% | The "Shared Crucible" factor makes events highly concentrated. Micro-events yield 3x more decision-stage outcomes than massive trade shows. Connections lose 60% of momentum if not followed up digitally within 24 hours. |
| Cold Outreach | 12% | Representing 12% of discovery, this is the most challenging channel. Hyper-relevance (connecting outreach to a specific trigger event) increases open rates by 210%. Response rates average 1.4%. |
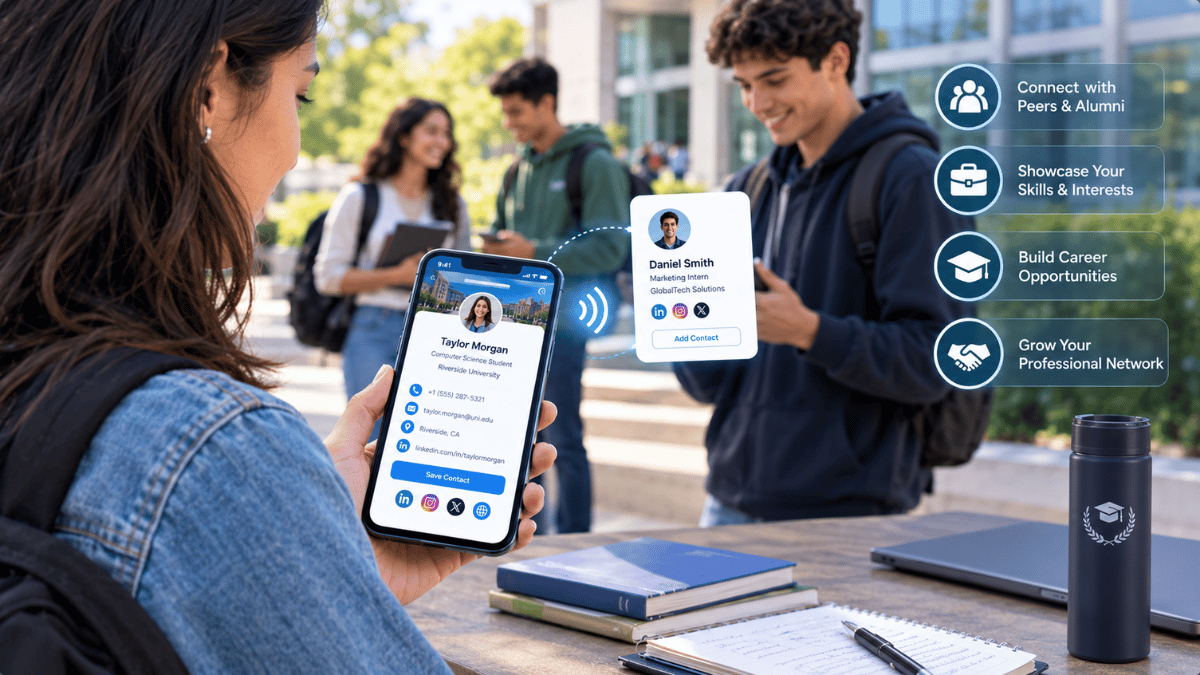
Regardless of the channel, the transition from discovery to a saved contact must be frictionless. Using a smart QR code during in-person events or social interactions ensures you capture the lead instantly before the context is lost.
Phase 2: Engagement
Discovery is merely potential; Engagement is kinetic. This section visualizes the drop-off rates and engagement momentum across different channels. Notice how rapidly attention decays without proper nurturing.
| Timeframe | Warm Intro (Referral) | Cold Social | Event Lead |
|---|---|---|---|
| Day 1 | 100% | 100% | 100% |
| Day 3 | 85% | 40% | 60% |
| Day 7 | 70% | 25% | 30% |
| Day 14 | 60% | 10% | 15% |
| Day 30 | 55% | 5% | 8% |
The "Day 3" Chasm
Across all non-referral channels, if a secondary interaction (reply, meeting booked, resource shared) does not occur by Day 3, the probability of the relationship progressing to the 'Decision' phase drops by 84%.
The Value-Add Cadence
Report Chapter 7 details the "Give-Give-Ask" framework. Connections nurtured with two pieces of unprompted, high-value insight before a formal request experience a 3x higher conversion rate.
Channel Switching
Moving a contact from the discovery platform (e.g., LinkedIn) to a more intimate channel (e.g., Email or WhatsApp) within the first week is the strongest indicator of successful engagement momentum. With Signify, you can use API integrations to push these leads directly into your CRM.
Phase 3: Evaluation
Before a decision is made, counterparts evaluate each other. What factors build trust? Our data reveals massive asymmetries based on the seniority of the person you are networking with.
| Trust Factor | C-Suite Executive | Mid-Level Manager | Startup Founder |
|---|---|---|---|
| Mutual Connections | 90% (Critical) | 50% (Moderate) | 40% (Low) |
| Company Pedigree | 85% (Critical) | 60% (Moderate) | 30% (Low) |
| Specific Skills | 40% (Low) | 80% (High) | 60% (Moderate) |
| Digital Brand/Content | 60% (Moderate) | 70% (High) | 90% (Critical) |
| Speed of Response | 30% (Low) | 85% (High) | 95% (Critical) |
Executives heavily index on mutual connections and institutional pedigree. They have limited time and use your existing network as a proxy for your reliability. Mid-level managers focus on execution and demonstrated skills. Founders value velocity, personal brand, and cultural alignment, looking for high agency and an active digital presence.
Phase 4: Decision
The ultimate goal of professional networking is an outcome—a hire, a deal, a partnership. This section visualizes the brutal reality of the networking funnel.
| Funnel Stage | Remaining Volume | Key Findings |
|---|---|---|
| 1. Initial Discovery | 100% | The starting point. High volume, low initial trust. |
| 2. Connection Made | 65% | 35% drop-off. Failure due to generic outreach or lack of immediate perceived value. |
| 3. Meaningful Dialogue | 22% | Steepest drop-off (65%). Caused by failing to transition from introduction to a substantive conversation. |
| 4. Proposal/Ask | 13% | 40% attrition rate. Caused by staying in the "friend zone" too long without clarifying intent. |
| 5. Closed Outcome | 4% | The final decision. Top performers fix this funnel by using "Micro-Commitments" and longer nurture cycles. |
The Data Sandbox: Industry Context
Dive into the specifics. Success rates of different networking asks vary wildly based on the target's industry.
| Ask Type | Technology & SaaS | Finance & Investment | Creative & Media |
|---|---|---|---|
| Formal Job Ask | 15% | 35% | 10% |
| Informal Feedback | 35% | 10% | 45% |
| Partnership/Investment | 25% | 40% | 15% |
| Collaboration Project | 8% | 5% | 20% |
In Tech, informal requests (like asking for product feedback) convert significantly higher than formal job inquiries. In Finance, structured formal introductions and direct investment inquiries yield the highest results. In Creative fields, collaborative asks vastly outperform direct hiring asks.
To ensure your team is equipped to handle these industry-specific nuances, explore Signify for Teams to standardize your networking approach.
Frequently asked questions
What is the most effective channel for networking discovery?
Referrals remain the undisputed king, accounting for 42% of high-value connections. They leverage "Trust Transfer," which drastically shortens the evaluation phase compared to cold outreach.
Why do networking relationships fail after the initial meeting?
The data points to a "Day 3 Chasm." If a secondary interaction (like a follow-up email or shared resource) doesn't happen within 3 days, the probability of the relationship progressing drops by 84%. Using a Signify digital card allows you to automate follow-ups instantly.
How do C-Suite executives evaluate new connections differently?
C-Suite executives heavily index on mutual connections (90%) and company pedigree (85%). They use your existing network as a proxy for reliability. In contrast, startup founders prioritize speed of response (95%) and digital brand presence (90%).
What is the "Give-Give-Ask" framework?
It is a networking strategy where you provide two pieces of unprompted, high-value insight to a connection before making a formal request. This builds trust and results in a 3x higher conversion rate to a meeting.
Master the Modern Networking Journey
Don't let your valuable connections fall into the "Day 3 Chasm." Equip yourself with the tools to capture contacts instantly, automate follow-ups, and track engagement with Signify.
Create Your Signify Card